From Question 2.1 to 2.9
Question 2.1
In which of the following examples of motion, can the body be considered approximately a point object?
(a) a railway carriage moving without jerks between two stations.
(b) a monkey sitting on top of a man cycling smoothly on a circular track.
(c) a spinning cricket ball that turns sharply on hitting the ground.
(d) a tumbling beaker that has slipped off the edge of a table.
Answer:
A body can be treated as a point object when:
- its size is negligible compared to the distance travelled, and
- rotation or shape does not affect the description of motion.
(a) Railway carriage ✔
The distance between stations is very large compared to the size of the carriage. Its size does not affect the motion.
Can be treated as a point object.
(b) Monkey on a man cycling ✔
The motion of the system (man + monkey) is smooth and its size is small compared to the circular track.
Can be treated as a point object.
(c) Spinning cricket ball ✘
The spinning and turning of the ball are important. Size and rotation cannot be ignored.
Cannot be treated as a point object.
(d) Tumbling beaker ✘
The beaker rotates and changes orientation while falling. Its shape matters.
Cannot be treated as a point object.
Correct answer: (a) and (b)
Question 2.2
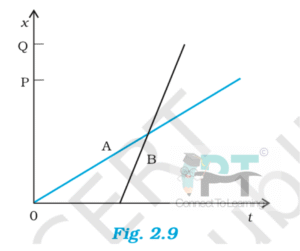
The position–time (x–t) graphs for two children A and B returning from their school O to their homes P and Q respectively are shown. Choose the correct entries in the brackets below:
(a) (A/B) lives closer to the school than (B/A)
(b) (A/B) starts from the school earlier than (B/A)
(c) (A/B) walks faster than (B/A)
(d) A and B reach home at the (same/different) time
(e) (A/B) overtakes (B/A) on the road (once/twice)
Answer:
Important ideas used:
- Distance from school → final position on x-axis
- Who starts earlier → whose graph begins earlier on time axis
- Speed → slope of x–t graph
- Overtaking → point where two graphs intersect
(a) A lives closer to the school than B
A’s final position is less than B’s.
A lives closer.
(b) B starts earlier than A
B’s graph begins at an earlier time.
B starts earlier.
(c) A walks faster than B
Slope of A’s graph is steeper than that of B.
A walks faster.
(d) A and B reach home at the same time
Both graphs end at the same time on the time axis.
Same time.
(e) A overtakes B once
The two graphs intersect at one point.
A overtakes B once.
Question 2.3
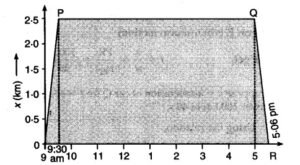
A woman starts from her home at 9.00 am, walks with a speed of 5 km h⁻¹ on a straight road up to her office 2.5 km away, stays at the office up to 5.00 pm, and returns home by an auto with a speed of 25 km h⁻¹. Choose suitable scales and plot the x–t graph of her motion.
Step 1: Choose origin and directions
- Take home as origin (x = 0).
- Direction from home to office is taken as positive x-direction.
- Motion is one-dimensional along a straight road.
Step 2: Motion from home to office
- Distance = 2.5 km
- Speed = 5 km h⁻¹
She starts at 9:00 am, so she reaches office at 9:30 am.
This part of motion is uniform motion, so x–t graph is a straight line with positive slope.
Step 3: Stay at office
- She stays from 9:30 am to 5:00 pm.
- Position remains constant at x = 2.5 km.
- Duration of rest = 7.5 hours.
On x–t graph, this is shown by a horizontal straight line.
Step 4: Return journey (office to home)
- Speed of auto = 25 km h⁻¹
- Distance = 2.5 km
She starts at 5:00 pm and reaches home at 5:06 pm.
Since she is moving towards home, displacement decreases.
The x–t graph is a straight line with negative slope, steeper than the walking line.
Step 5: Summary of key points for the graph
| Time | Position x (km) | Nature of motion |
|---|---|---|
| 9:00 am | 0 | Start from home |
| 9:30 am | 2.5 | Walks uniformly |
| 9:30 am – 5:00 pm | 2.5 | At rest |
| 5:06 pm | 0 | Returns home uniformly |
Step 6: Choosing suitable scales
You may choose, for example:
- Time axis (t-axis):
1 cm = 1 hour - Position axis (x-axis):
1 cm = 0.5 km
(Any other convenient and proportional scale is acceptable.)
Step 7: Shape of the x–t graph
- Straight rising line from (9:00 am, 0) to (9:30 am, 2.5 km)
- Horizontal line from 9:30 am to 5:00 pm at x = 2.5 km
- Steep straight falling line from (5:00 pm, 2.5 km) to (5:06 pm, 0)
Question 2.4
A drunkard walking in a narrow lane takes 5 steps forward and 3 steps backward, followed again by 5 steps forward and 3 steps backward, and so on. Each step is 1 m long and requires 1 s. Plot the x–t graph of his motion. Determine graphically and otherwise how long the drunkard takes to fall in a pit 13 m away from the start.
Step 1: Understand the motion
- Length of each step = 1 m
- Time for each step = 1 s
One complete cycle:
- Forward steps = 5 m in 5 s
- Backward steps = 3 m in 3 s
Net displacement in one cycle
Time for one cycle
Step 2: Motion in successive cycles
| Cycle | Time (s) | Net position (m) |
|---|---|---|
| 1 | 8 | 2 |
| 2 | 16 | 4 |
| 3 | 24 | 6 |
| 4 | 32 | 8 |
| 5 | 40 | 10 |
| 6 | 48 | 12 |
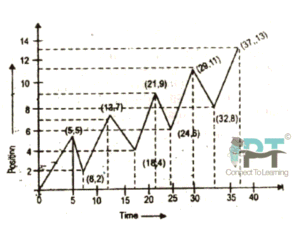
After 6 cycles, the drunkard reaches 12 m.
Step 3: Final motion to the pit
The pit is at 13 m from the start.
At the end of 6 cycles:
- Position = 12 m
- Time = 48 s
Now the drunkard moves forward:
- 1 forward step = 1 m in 1 s
So, to go from 12 m to 13 m:
Step 4: Total time (by calculation)
Step 5: x–t graph description (graphical method)
How to draw the x–t graph:
- x-axis → time (s)
- y-axis → position (m)
Nature of graph:
- Slanted rising straight lines → forward motion
- Slanted falling straight lines → backward motion
- Repeated zig-zag pattern
- The graph finally reaches x = 13 m at t = 49 s
From the graph, the point where the line first touches x = 13 m gives the same result:
Question 2.5
A car moving along a straight highway with speed of 126 km h⁻¹ is brought to a stop within a distance of 200 m. What is the retardation of the car (assumed uniform), and how long does it take for the car to stop?
Step 1: Write the given data
- Initial speed,
- Final speed,
- Distance covered before stopping,
Step 2: Find the retardation
Use the equation of motion:
Substitute the values:
Retardation
(Negative sign indicates deceleration or retardation.)
Step 3: Find the time taken to stop
Use the equation:
Question 2.6
A player throws a ball upwards with an initial speed of 29.4 m s⁻¹.
(a) What is the direction of acceleration during the upward motion of the ball?
(b) What are the velocity and acceleration of the ball at the highest point of its motion?
(c) Choose x = 0 m and t = 0 s to be the location and time of the ball at its highest point, vertically downward direction to be the positive direction of x-axis, and give the signs of position, velocity and acceleration of the ball during its upward and downward motion.
(d) To what height does the ball rise and after how long does the ball return to the player’s hands?
(Take g = 9.8 m s⁻² and neglect air resistance.)
(a) Direction of acceleration during upward motion
The acceleration of the ball is due to gravity, which always acts vertically downward, irrespective of the direction of motion.
Answer:
The acceleration during upward motion is vertically downward.
(b) Velocity and acceleration at the highest point
At the highest point:
- The ball momentarily comes to rest, so velocity is zero.
- Gravity still acts downward, so acceleration is not zero.
Answer:
- Velocity = 0
- Acceleration = 9.8 m s⁻² downward
(c) Signs of position, velocity and acceleration
Given sign convention:
- Highest point → x = 0 m
- Time at highest point → t = 0 s
- Downward direction is positive
Upward motion (before reaching highest point)
- Position: Below the highest point → negative
- Velocity: Moving upward (opposite to positive direction) → negative
- Acceleration: Gravity acts downward → positive
Downward motion (after highest point)
- Position: Below the highest point → positive
- Velocity: Moving downward → positive
- Acceleration: Gravity acts downward → positive
(d) Maximum height and time of flight
Given:
- Initial speed,
- Acceleration due to gravity,
- Velocity at highest point,
Maximum height reached
Use:
Time to reach highest point
Use:
Total time to return to player
Time of ascent = Time of descent
Question 2.7
Read each statement below carefully and state with reasons and examples, if it is true or false. A particle in one-dimensional motion:
(a) with zero speed at an instant may have non-zero acceleration at that instant
Answer: True
Reason:
Speed can be zero at an instant while acceleration is non-zero if the velocity is changing at that instant.
Example:
A ball thrown vertically upward has zero speed at the highest point, but its acceleration due to gravity is 9.8 m s⁻² downward.
(b) with zero speed may have non-zero velocity
Answer: False
Reason:
Velocity is a vector quantity whose magnitude is speed.
If speed is zero, the magnitude of velocity is zero, hence velocity must also be zero.
Example:
An object at rest has zero speed and zero velocity.
(c) with constant speed must have zero acceleration
Answer: False
Reason:
Acceleration depends on change in velocity. Velocity can change due to change in direction even if speed remains constant.
Example:
Uniform circular motion has constant speed, but acceleration is present because direction of velocity changes continuously.
(Note: In one-dimensional straight-line motion, constant speed implies zero acceleration.)
(d) with positive value of acceleration must be speeding up
Answer: False
Reason:
Whether a particle speeds up or slows down depends on the relative directions of velocity and acceleration, not just the sign of acceleration.
Example:
A ball thrown vertically upward has positive acceleration downward, but its speed decreases during upward motion.
Question 2.8
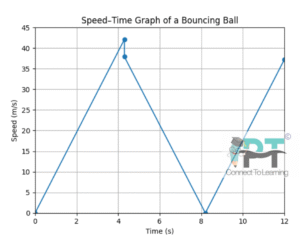
A ball is dropped from a height of 90 m on a floor. At each collision with the floor, the ball loses one-tenth of its speed. Plot the speed–time graph of its motion between t = 0 to 12 s.
Given
-
Height,
-
Initial velocity,
-
Acceleration due to gravity,
-
At each collision, speed reduces to of its value just before impact.
Step 1: First fall (0 to first impact)
Using
Speed just before hitting the floor:
Step 2: Speed just after first collision
Loss of one-tenth speed:
This is upward speed immediately after collision.
Step 3: Motion after first bounce
-
The ball moves upward, speed decreases uniformly to zero.
-
Time to reach maximum height:
-
Total time till top of first bounce:
Speed becomes zero at this point.
Step 4: Second fall (within 12 s)
-
From 8.2 s onward, the ball starts falling again.
-
Speed increases linearly from 0.
-
Time available:
Speed at :
(No second collision occurs within 12 s.)
Speed–Time Graph (Description)
0 to 4.3 s → Straight line rising from 0 to 42.1 m/s
Sudden drop at 4.3 s to 37.9 m/s (collision)
4.3 to 8.2 s → Straight line falling to zero (upward motion)
8.2 to 12 s → Straight line rising again (downward motion)
⚠️ Important NCERT Point:
Speed–time graph has sharp vertical drops at collision points because speed changes suddenly.
Question 2.9
Explain clearly, with examples, the distinction between:
(a) Magnitude of displacement and total path length
(b) Magnitude of average velocity and average speed
Show that in both cases the second quantity is greater than or equal to the first.
When does equality hold?
(Consider one-dimensional motion only.)
(a) Displacement (magnitude) vs Total Path Length
Displacement
-
Displacement is the shortest straight-line distance between the initial and final positions of a particle.
-
It depends only on the initial and final positions, not on the actual path followed.
-
It can be positive, negative or zero.
-
Its magnitude is always less than or equal to the path length.
Total Path Length (Distance)
-
Total path length is the actual length of the path travelled by the particle.
-
It depends on the entire motion.
-
It is always positive.
-
It is always greater than or equal to the magnitude of displacement.
Example
Suppose a particle moves:
-
From m to ,
-
Then back to .
-
Magnitude of displacement
-
Total path length
Equality condition
-
Equality holds only when the particle moves in a straight line without changing direction.
(b) Magnitude of Average Velocity vs Average Speed
Average Velocity
-
Average velocity is defined as:
-
Its magnitude depends only on displacement.
-
It can be zero, even if the particle has moved.
Average Speed
-
Average speed is defined as:
-
It depends on the entire distance travelled.
-
It is always positive.
Why average speed ≥ magnitude of average velocity
Since:
Dividing both sides by time:
Example
A person walks:
-
10 m forward in 10 s,
-
then 10 m backward in 10 s.
-
Displacement = 0
-
Total path length = 20 m
-
Time = 20 s
Equality condition
-
Equality holds only when motion is along a straight line without reversal of direction.
Final Conclusion (Very Important for Exams)
| Quantity | Comparison |
|---|---|
| Path length | ≥ Magnitude of displacement |
| Average speed |
≥ Magnitude of average velocity |
Equality holds only for straight-line motion in one direction.