Go Back to CLASS 11TH PHYSICS Page
Question 2.10
A man walks on a straight road from his home to a market 2.5 km away with a speed of 5 km h⁻¹. Finding the market closed, he instantly turns back and walks home with a speed of 7.5 km h⁻¹.
Find:
(a) Magnitude of average velocity
(b) Average speed
for the time intervals:
(i) 0 to 30 min, (ii) 0 to 50 min, (iii) 0 to 40 min
Given
-
Distance to market = 2.5 km
-
Speed while going = 5 km h⁻¹
-
Speed while returning = 7.5 km h⁻¹
Step 1: Time taken in each part
Time to reach market
Time to return home
Total time for complete journey
(i) Time interval: 0 to 30 min
During this time, the man only walks towards the market.
Displacement
Total path length
(a) Magnitude of average velocity
(b) Average speed
(ii) Time interval: 0 to 50 min
The man goes to the market and returns home.
Displacement
Total path length
(a) Magnitude of average velocity
(b) Average speed
(iii) Time interval: 0 to 40 min
-
First 30 min: reaches market
-
Next 10 min: returns home
Distance covered in 10 min return
Speed = 7.5 km h⁻¹
Time = 10 min = 1/6 h
Position after 40 min
Displacement
Total path length
(a) Magnitude of average velocity
(b) Average speed
Question 2.11
In Exercises 2.9 and 2.10, we distinguished between average speed and magnitude of average velocity. However, no such distinction is required for instantaneous speed and instantaneous velocity. Why? Explain.
Answer
Key Idea
The difference between speed and velocity arises because they are defined over a finite time interval. But instantaneous quantities are defined at a single instant of time.
Definitions
Instantaneous velocity
Instantaneous velocity at a given instant is defined as:
It has both magnitude and direction.
Instantaneous speed
Instantaneous speed is defined as:
It has only magnitude, no direction.
Why are they always equal in magnitude?
-
Over an infinitesimally small time interval (Δt→0):
-
The distance travelled becomes equal to the magnitude of displacement.
-
There is no change of direction in that tiny interval.
-
-
Hence,
Why the distinction disappears
-
For average quantities, the particle may:
-
change direction,
-
retrace its path,
-
or return to the starting point.
-
-
For instantaneous quantities, motion is examined at a single point in time, so:
-
path length = displacement (in magnitude),
-
speed = magnitude of velocity.
-
Question 2.12
Look at the graphs (a) to (d) (Fig. 2.10) carefully and state, with reasons, which of these cannot possibly represent one-dimensional motion of a particle.
Answer:
In one-dimensional motion:
-
At a given instant of time, a particle can have only one position.
-
Speed can never be negative.
-
A graph must satisfy the physical meaning of the quantities on the axes.
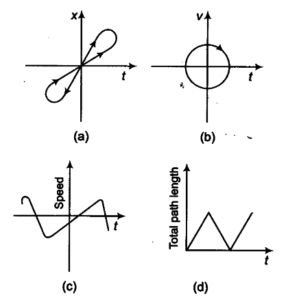
(a) – Possible
-
This graph represents a particle moving forward and then backward.
-
At every instant of time, there is only one position.
-
✔️ Physically possible in one-dimensional motion.
(b) – Not Possible ❌
-
This graph shows more than one position for the same time.
-
A vertical line cuts the graph at more than one point.
-
This means the particle is at two positions at the same time, which is impossible.
Cannot represent one-dimensional motion.
(c) – Possible
-
This graph represents motion where speed increases and then decreases.
-
Speed remains positive throughout.
-
✔️ Physically possible.
(d) – Not Possible ❌
-
This graph shows negative values of speed.
-
Speed is a scalar quantity and cannot be negative.
-
Negative values have no physical meaning for speed.
Cannot represent one-dimensional motion.
Question 2.13
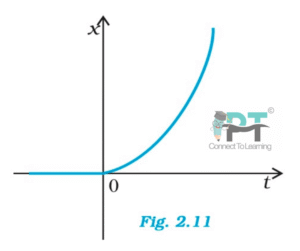
Figure 2.11 shows the x–t plot of one-dimensional motion of a particle. Is it correct to say from the graph that the particle moves in a straight line for and on a parabolic path for ? If not, suggest a suitable physical context for this graph.
Answer
No, this interpretation is NOT correct.
The statement is incorrect because the given figure is an x–t (position–time) graph, not a path diagram.
Correct Explanation
-
The graph shows how position x
of the particle changes with time t
-
It does not represent the actual path in space.
-
Therefore:
-
A straight line in an x–t graph does not mean straight-line motion in space.
-
A parabolic curve in an x–t graph does not mean a parabolic path.
-
In fact, the motion is one-dimensional throughout, i.e., the particle always moves along the same straight line (x-axis) for all values of time.
Question 2.14
A police van moving on a highway with a speed of 30 km h⁻¹ fires a bullet at a thief’s car speeding away in the same direction with a speed of 192 km h⁻¹. If the muzzle speed of the bullet is 150 m s⁻¹, with what speed does the bullet hit the thief’s car?
(Relevant speed is the speed of the bullet relative to the car.)
Step 1: Convert all speeds into SI units
Police van speed
Thief’s car speed
Step 2: Speed of bullet relative to ground
The bullet is fired from the moving police van, so its speed relative to the ground is:
Step 3: Speed of bullet relative to thief’s car
This is the speed that causes damage.
Question 2.15
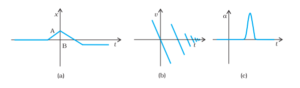
Suggest a suitable physical situation for each of the graphs shown in Fig. 2.12.
Graph-wise Analysis
Graph (a): x–t graph (Position–Time) ✅ Possible
-
The particle moves forward, reaches a maximum position, and then moves backward.
-
At every instant of time, there is only one position.
-
The sharp corner only indicates a sudden change in velocity, which is allowed in an idealised graph.
✔️ This CAN represent one-dimensional motion.
Graph (b): v–t graph (Velocity–Time) ❌ Not Possible
-
At the same instant of time, the graph shows more than one velocity (multiple slanted lines overlapping the same time).
-
In one-dimensional motion, a particle can have only one velocity at a given instant.
❌ This CANNOT represent one-dimensional motion.
Graph (c): a–t graph (Acceleration–Time) ✅ Possible
-
Acceleration is zero most of the time and becomes non-zero for a short interval.
-
This can happen when a force acts briefly, such as:
-
a bat hitting a ball,
-
a hammer striking a nail.
-
✔️ This CAN represent one-dimensional motion.
Question 2.16
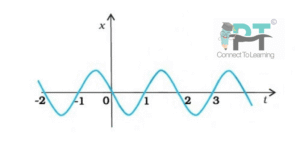
Figure 2.13 gives the x–t plot of a particle executing one-dimensional simple harmonic motion.
(You will learn about this motion in more detail in Chapter 13).
Give the signs of position, velocity and acceleration variables of the particle at
Answer
From the given x–t graph of SHM:
-
Position (x): sign depends on whether the curve is above (+) or below (–) the time axis.
-
Velocity (v): sign depends on the slope of the x–t graph
-
rising → v positive
-
falling → v negative
-
-
Acceleration (a) in SHM:
so acceleration is always opposite in sign to displacement.
At
-
Position: negative (below x-axis)
-
Velocity: negative (curve falling)
-
Acceleration: positive (opposite to x)
At
-
Position: positive (above x-axis)
-
Velocity: negative (curve falling)
-
Acceleration: negative
At
-
Position: positive
-
Velocity: positive (curve rising)
-
Acceleration: negative
Final Summary Table
| Time (s) | Position (x) | Velocity (v) | Acceleration (a) |
|---|---|---|---|
| 0.3 | – | – | + |
| 1.2 | + | – | – |
| –1.2 | + | + | – |
Question 2.17
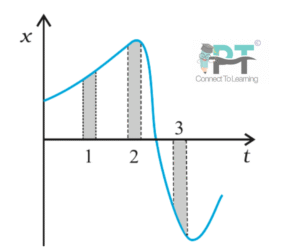
Figure 2.14 gives the x–t plot of a particle in one-dimensional motion. Three different equal intervals of time are shown.
(a) In which interval is the average speed greatest, and in which is it the least?
(b) Give the sign of average velocity for each interval.
Answer
Key ideas to use:
-
Average speed = total distance covered ÷ time
→ depends on how steep the x–t graph is (ignores direction). -
Average velocity = displacement ÷ time
→ sign depends on whether x increases (+) or decreases (–) with time.
(a) Average speed
From the graph (equal time intervals):
-
Greatest average speed → Interval II
(the graph is steepest → maximum distance covered in the same time) -
Least average speed → Interval I
(the graph is least steep → minimum distance covered)
(b) Sign of average velocity
-
Interval I: position increases with time
→ average velocity is positive (+) -
Interval II: position still increases with time
→ average velocity is positive (+) -
Interval III: position decreases with time
→ average velocity is negative (–)
Question 2.18
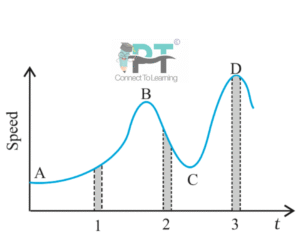
Figure 2.15 gives a speed–time graph of a particle in motion along a constant direction.
Three equal intervals of time are shown.
(a) In which interval is the average acceleration greatest in magnitude?
(b) In which interval is the average speed greatest?
(c) Choosing the positive direction as the constant direction of motion, give the signs of velocity (v) and acceleration (a) in the three intervals.
(d) What are the accelerations at the points A, B, C and D?
Answer
Key ideas from a speed–time (v–t) graph
-
Average acceleration = slope of the v–t graph over an interval
-
Average speed = average value of speed in that interval
-
Instantaneous acceleration at a point = slope of the tangent at that point
-
Motion is along a constant positive direction, so v is always positive
(a) Interval with greatest average acceleration (magnitude)
-
The steepest change of speed occurs in Interval I
(b) Interval with greatest average speed
-
The highest speeds overall are in Interval III
(c) Signs of velocity and acceleration
Since the particle always moves in the chosen positive direction:
| Interval | Velocity (v) | Acceleration (a) | Reason |
|---|---|---|---|
| I | + | + | Speed increasing |
| II | + | – | Speed decreasing |
| III | + | + | Speed increasing |
(d) Accelerations at points A, B, C and D
Acceleration at a point = slope of the v–t curve at that point.
| Point | Acceleration |
|---|---|
| A | Positive (speed increasing) |
| B |
Zero (maximum speed → slope zero) |
| C |
Negative (speed decreasing) |
| D | Zero (minimum speed → slope zero) |